


RoboSellers is an economics and entrepreneurship learning game developed with Junior Achievement that focuses on the role of money in business decisions. Players operate a robot parts business, traveling between planets to buy and sell inventory while managing costs, pricing, spending, and saving.
Explore →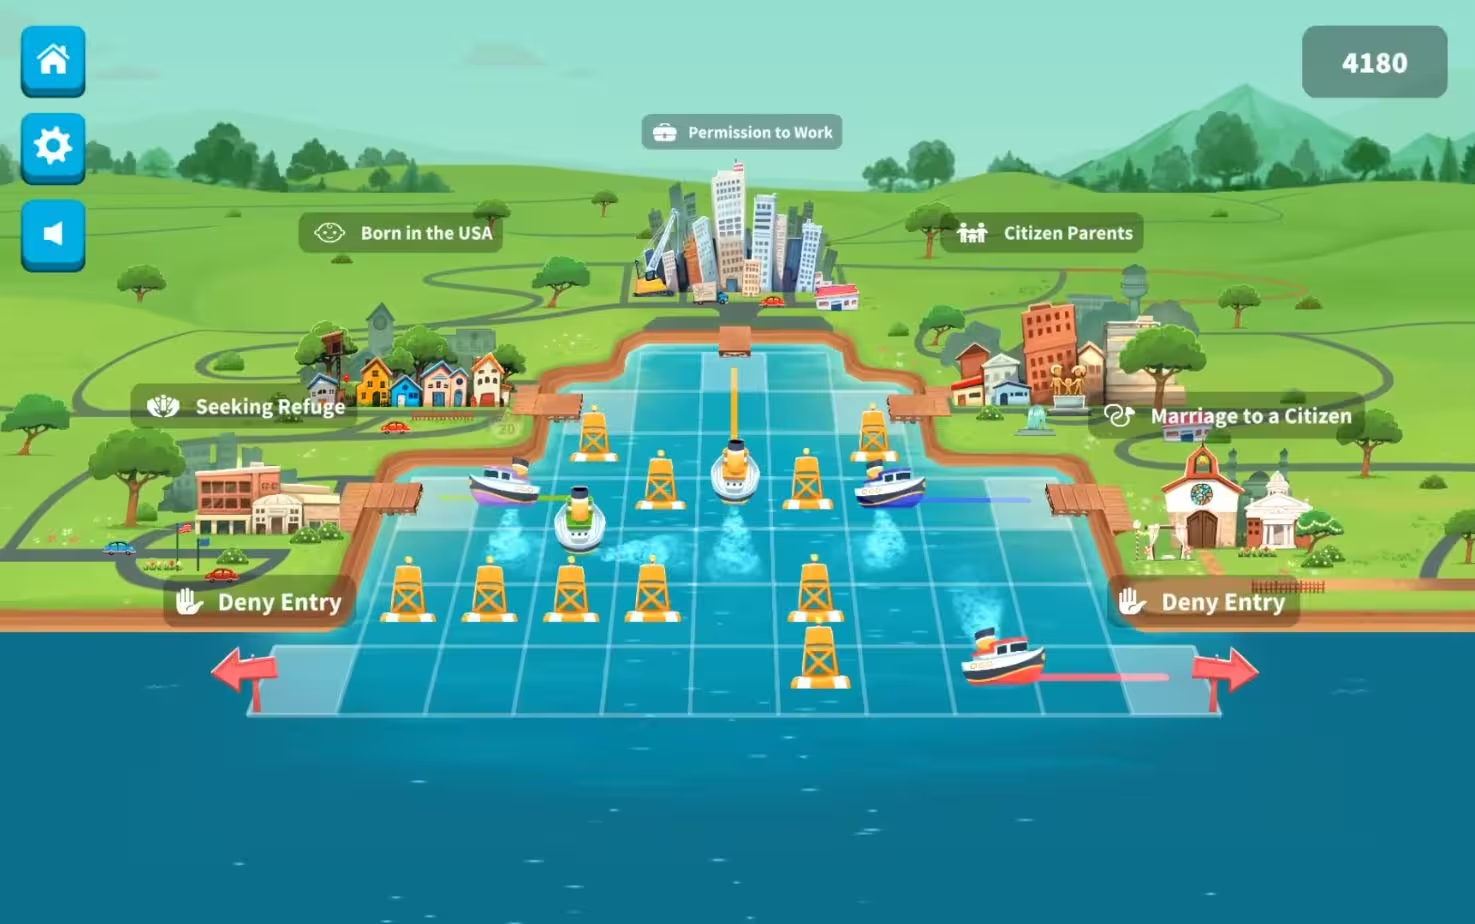
Immigration Nation is a civics learning game developed with iCivics that focuses on the U.S. immigration and naturalization process. Players guide individuals through pathways to legal residence and citizenship by applying eligibility rules and making decisions within a turn-based system.
Explore →Earlier this week we looked at what it takes to prove a learning game works. The follow-up question is what happens to that data once you have it, and for most K-12 products the answer is the tried-and-true teacher-facing dashboard. Research on those dashboards consistently identifies the same adoption factor - the numbers need to provide information that the teacher can act on, especially for those just-in-time interventions that can make or break a student’s class session. These are the principles we apply when designing reporting into a learning game.
In a 2022 study in Technology, Knowledge and Learning, teachers using a purpose-built discussion analytics dashboard were emphatic that the tool needed to move past describing the current state and toward what they should do next. The opening question in a dashboard spec is therefore which decision the teacher is making tomorrow morning, and what information would change their answer. Chart selection becomes straightforward once that decision is written down. The same study found that involving teachers throughout the design process and giving them control over the tool improved adoption in practice. This can be a more complex undertaking than a round of usability testing at the end, and it pays for itself quickly, since an experienced teacher will identify in the first session which distinctions matter in their classroom and which ones they will end up ignoring.
Adoption also depends on where the dashboard lives, and the strongest position is inside software the teacher already has up and running. This is one of the better practical arguments for the LTI standard, since LTI Advantage's Assignment and Grade Services can push scores directly into the LMS gradebook a teacher checks anyway, and Names and Roles Provisioning supplies your game with the class roster without requiring a second account system. A report one click from the assignment is opened as part of an existing routine, providing seamless operational intelligence to the educator.
The most valuable panel on a teacher dashboard reports progress against the learning objective. Session counts and completion percentages are easy to compute and also offer important insights in terms of adoption and progress, but they don’t relay much to the teacher about which subject matter they need to emphasize or revisit, if any. By contrast, a view organized around competencies indicates where to focus small-group instruction. In our design vocabulary this means reporting on the verbs, since the player's actions are the expression of the learning objective, and a well-built game logs them at the moment of decision.
The handling of student data is governed by COPPA and FERPA, so dashboards need to align strictly to their protocols. Data minimization is a productive design constraint, since a dashboard reporting competency progress generally requires less personal information than teams assume at the outset, and defaulting to aggregate views with drill-down on demand serves both the teacher's glance and the district's data agreement. Determine what you are collecting and why during design, well ahead of the district security review.
A 2025 systematic review of AI-powered learning analytics dashboards in Discover Education found that the field leans heavily on small-scale evaluations with limited deployment in live classroom settings. Closing that gap is largely a matter of instrumenting your own reporting and placing it in classrooms early. Ship the first version to a handful of teachers, observe which panels are opened and which are scrolled past, and let that determine the next release.
~
The strongest teacher dashboards we have worked on came out of the same process as the games themselves, which is to say - a considerable number of conversations with the people who would use them. But if this blog is any indication, we definitely like to talk, so that’s no problem for us! Reporting designed that way becomes part of what makes a game worth adopting rather than a requirement satisfied at the end of the project.
Interested in building the reporting layer for your next project? Let's talk!
Best practices for preventing motion sickness while maximizing learning outcomes.
Best practices for preventing motion sickness while maximizing learning outcomes.
Get the latest Game-Based Learning Review content delivered to your inbox, including new articles, videos, and industry insights.